CipherTrust Manager System Monitoring
CipherTrust Manager has four mechanisms to monitor its system activity.
Server audit and client audit records include general auditable events available in the GUI, CLI, and REST API in a user-readable JSON format, which can be used to create alarms.
Note
Consult documentation for a specific CipherTrust connector for information on configuring and interpreting client records.
Debug logs are more detailed downloadable LTSV files intended for troubleshooting CipherTrust Manager operations with Thales customer support.
KMIP and NAE activity logs are downloadable JSON format files that include information on operations performed through the KMIP and NAE interfaces.
Prometheus Metrics Endpoint is now available as a technical preview feature. This endpoint allows the Prometheus monitoring system to scrape the CipherTrust Manager continuously, providing metrics over time to help monitor overall system health, performance, and cryptographic activity. As well, there is a sample configuration available on request, including Prometheus and Grafana data visualization application Docker containers.
Caution
This feature is a technical preview for evaluation in non-production environments. A technical preview introduces new, incomplete functionality for customer feedback as we work on the feature. Details and functionality are subject to change. This includes API endpoints, UI elements, and CLI commands. We cannot guarantee that data created as part of a technical preview will be retained after the feature is finalized.
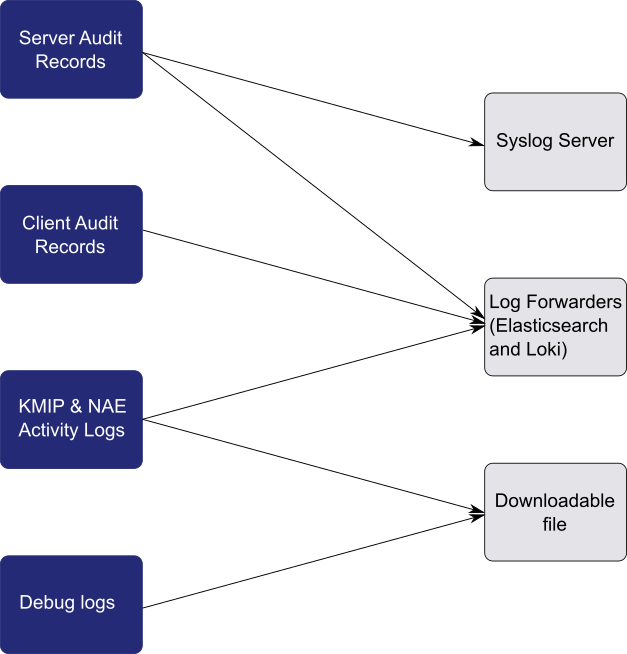
The system records and logs can be exported to various external locations.
Server audit records can be sent to an external syslog server and to an Elasticsearch or Loki log forwarder.
Client audit records can be sent to an Elasticsearch or Loki log forwarder.
KMIP and NAE activity logs can be sent to an Elasticsearch or Loki log forwarder and are downloadable to a JSON file.
Debug logs are downloadable to an LTSV file.


