ELK Reference
This guide provides a guide to search, order and filter data exported from Data Discovery and Classification reports on an external server, ELK.
"ELK" is the acronym for three open source projects: Elasticsearch, Logstash, and Kibana. Elasticsearch is a search and analytics engine. Logstash is a server‑side data processing pipeline that ingests data from multiple sources simultaneously, transforms it, and then sends it to a "stash" like Elasticsearch.
Requisites
You need to have the ELK 7.13 stack running before you can start any of the steps of this documentation. You have different options depending on what best fits your use case or your preferences:
Official ELK website: Here you can choose between these two options:
Self-managed: Download Elasticsearch and Kibana and run them on a local system. The tested platforms are Windows and Linux (Debian).
Cloud: Paid solution that brings you the ELK stack in a cloud managed service for a month subscription
How to ingest data objects in ELK
This section describes the process of ingesting one data objects file into Elasticsearch.
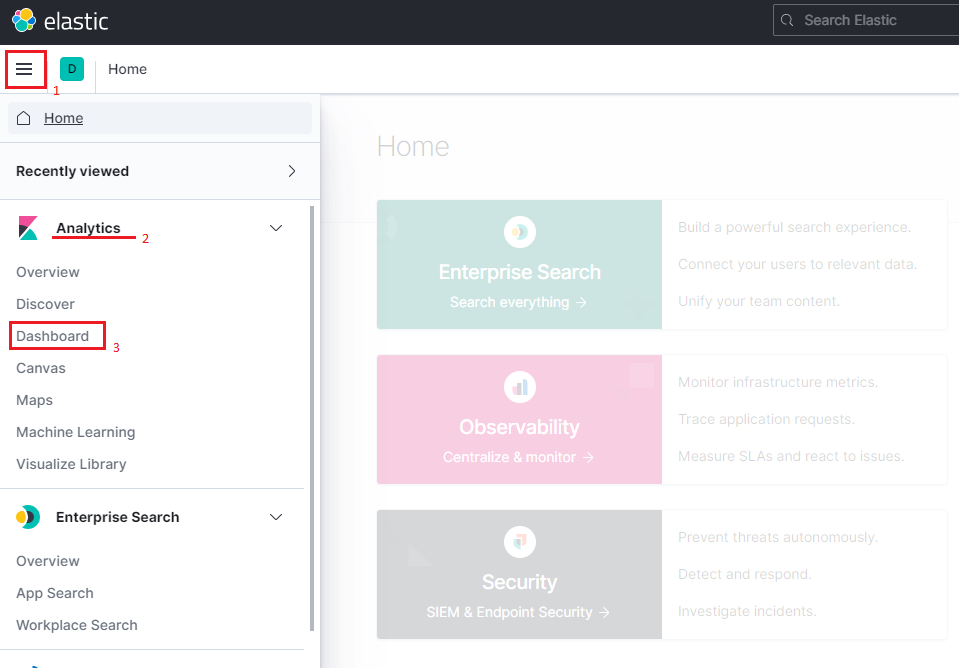
Open your ELK UI. By default you should be on the Home page. If not, navigate to it using the menu bar icon on the left of the navigation header
1and then click in the Home section2.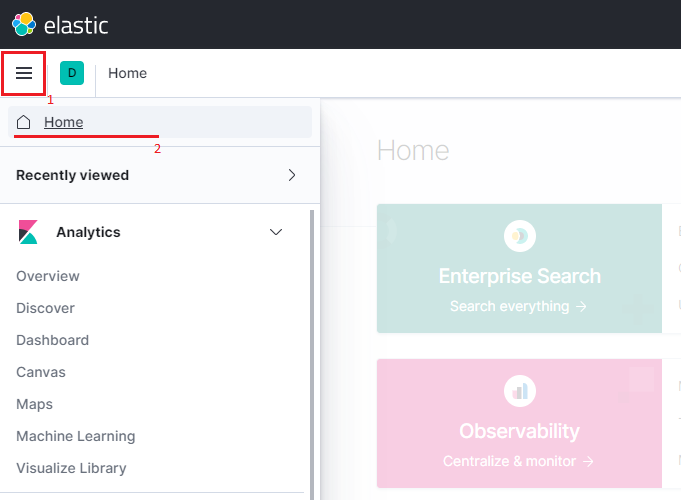
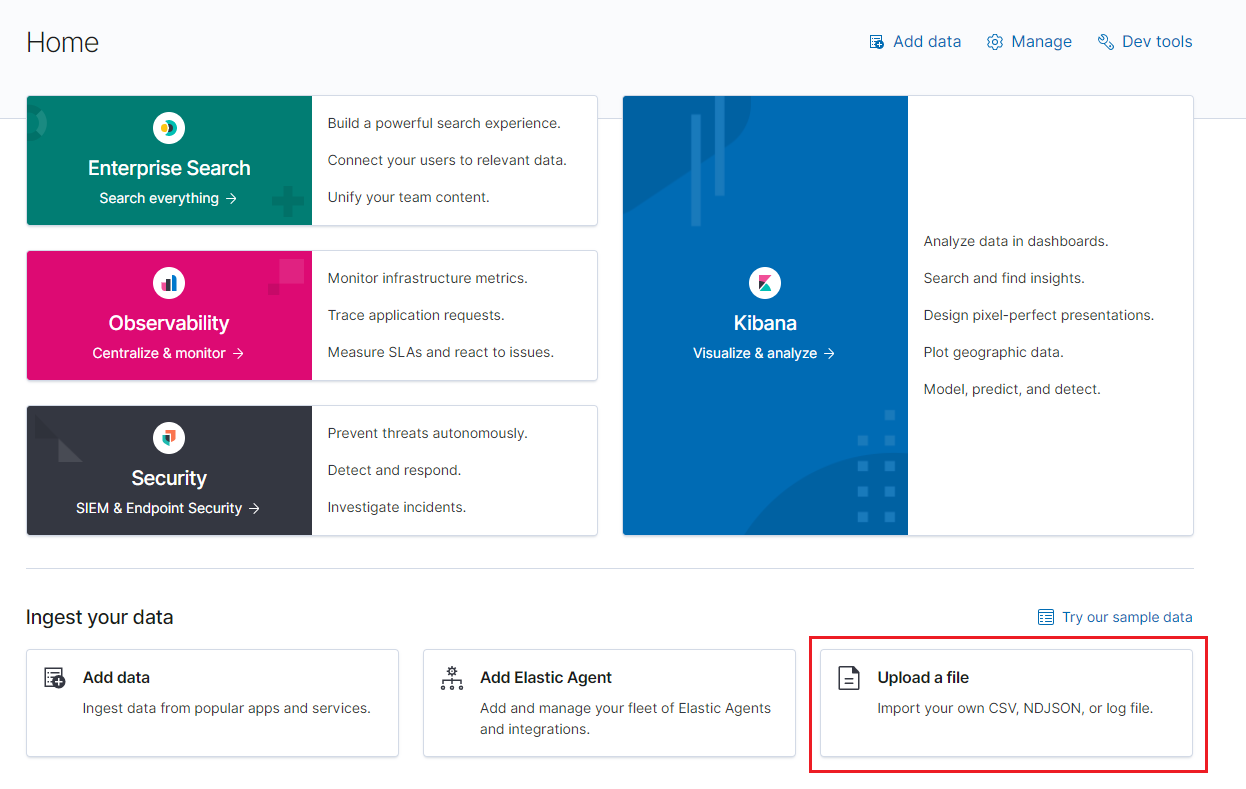
Inside the Home section, click the Upload a file option and in the new page click Select or drag and drop a file and choose the data object file (ndjson format) to import.
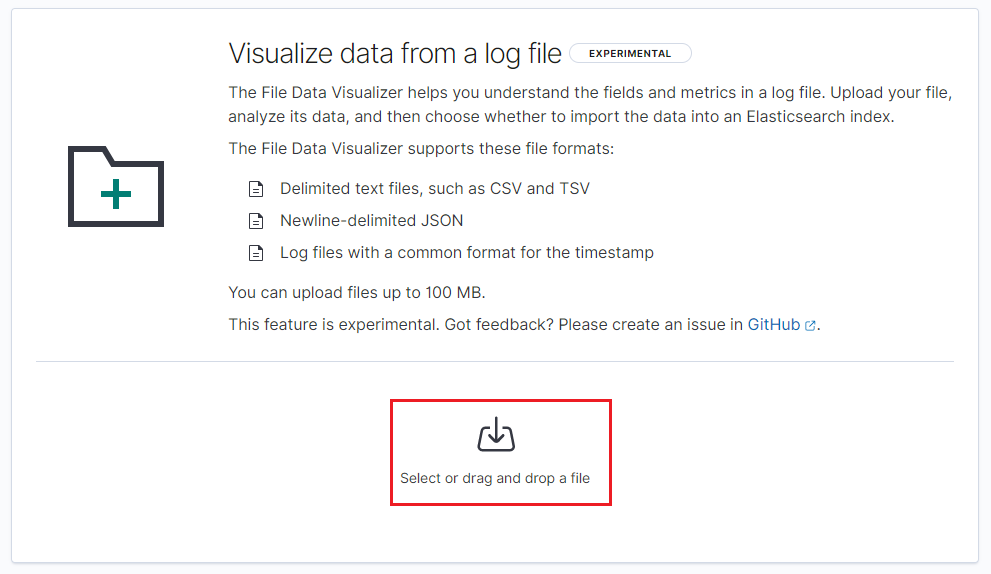
You will now see a page with the preview and the summary of the file content. At the bottom, click the Import button to continue.
In this form several steps are necessary:
Move to the Advanced tab.
Fill in the index name with the name that you want to give to this specific data objects file. This name is used by Elasticsearch.
Warning
Write down this name. You will need it when importing a dashboard.
Uncheck the Create index pattern option.
Replace the Mappings section content with the following JSON snippet:
{
    "dynamic": false,
    "properties": {
        "datastoreId": {
            "type": "keyword"
        },
        "datastoreName": {
            "type": "keyword"
        },
        "infotypesDistribution": {
            "properties": {
                "name": {
                    "type": "keyword"
                },
                "category": {
                    "type": "keyword"
                },
                "value": {
                    "type": "long"
                }
            }
        },
        "infotypesTotal": {
            "type": "long"
        },
        "matches": {
            "type": "long"
        },
        "name": {
            "type": "keyword"
        },
        "path": {
            "type": "keyword"
        },
        "classificationProfiles": {
            "type": "keyword"
        },
        "encryptionTimestamp": {
            "type": "date"
        },
        "remediationStatus": {
            "type": "keyword"
        },
        "policyId": {
            "type": "keyword"
        },
        "policyName": {
            "type": "keyword"
        },
        "risk": {
            "type": "long"
        },
        "scanExecutionId": {
            "type": "keyword"
        },
        "scanId": {
            "type": "keyword"
        },
        "type": {
            "type": "keyword"
        }
    }
}
You should finally see something like this:
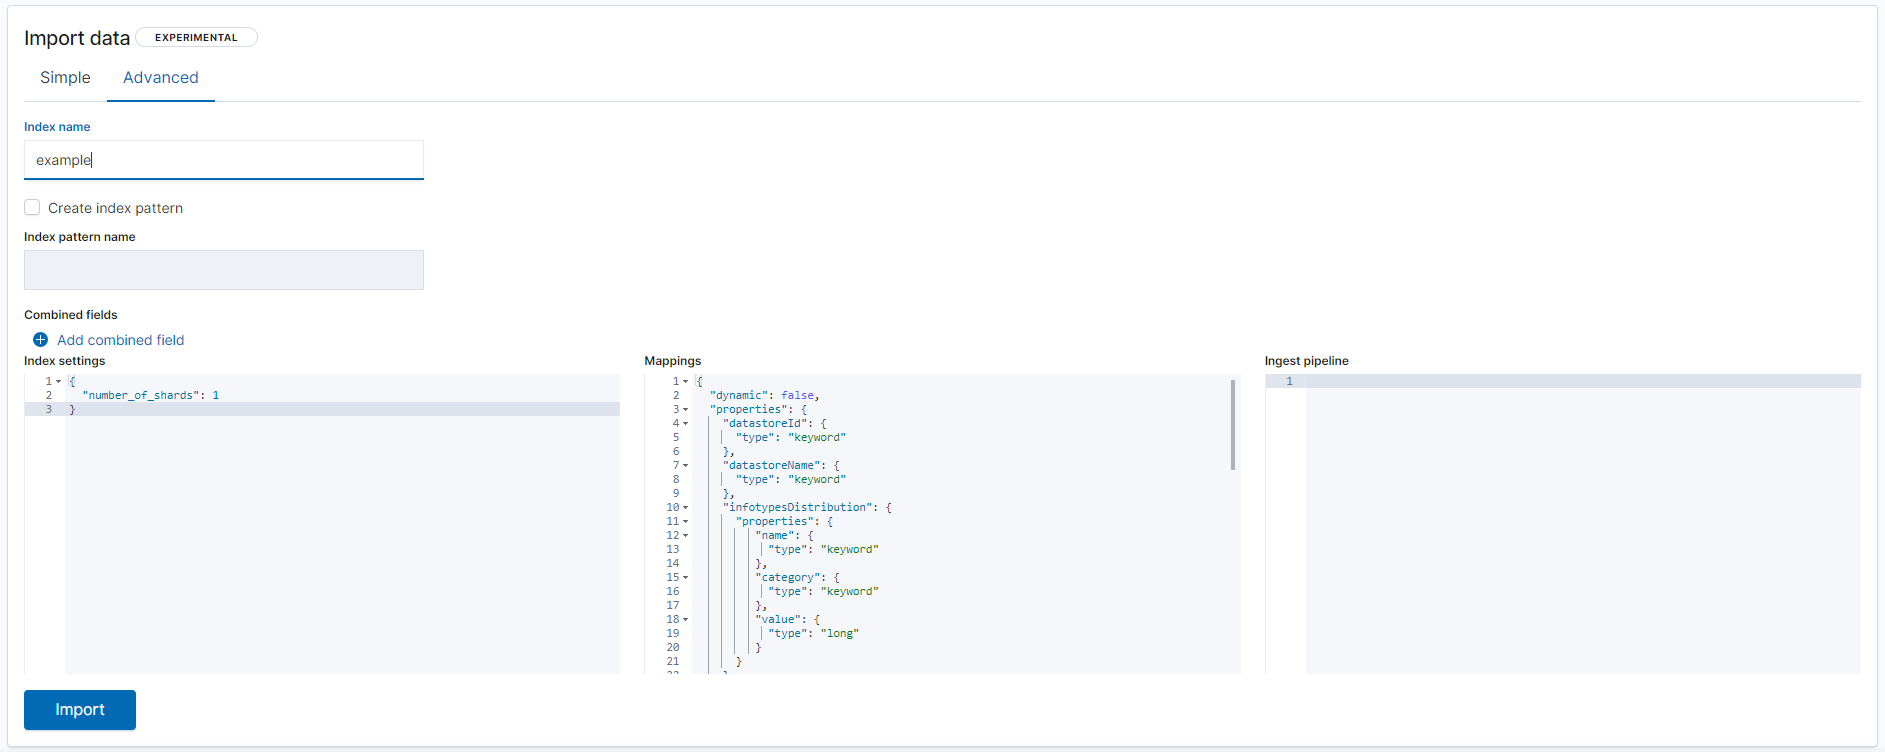
Finally click the Import button at the bottom to finish the process and wait for the data to be ingested.
How to import the ELK dashboard
The dashboard.ndjson is the file that we distribute to add Data Discovery and Classification dashboard attributes to the downloaded report file. This section describes how to import one dashboard in order to be used with one data objects file already ingested in ELK (see the previous section).
Open the dashboard.ndjson file with your favorite editor. You have to change the property called title in the first line and give a name that matches the index name that you created when you ingested your data objects file (see step 4.2 from How to ingest data objects in ELK). Save the changes.

Open your ELK UI. Click the bars menu icon on the left of the navigation header
1and search for Management2→ Stack Management3and click it to navigate to the section.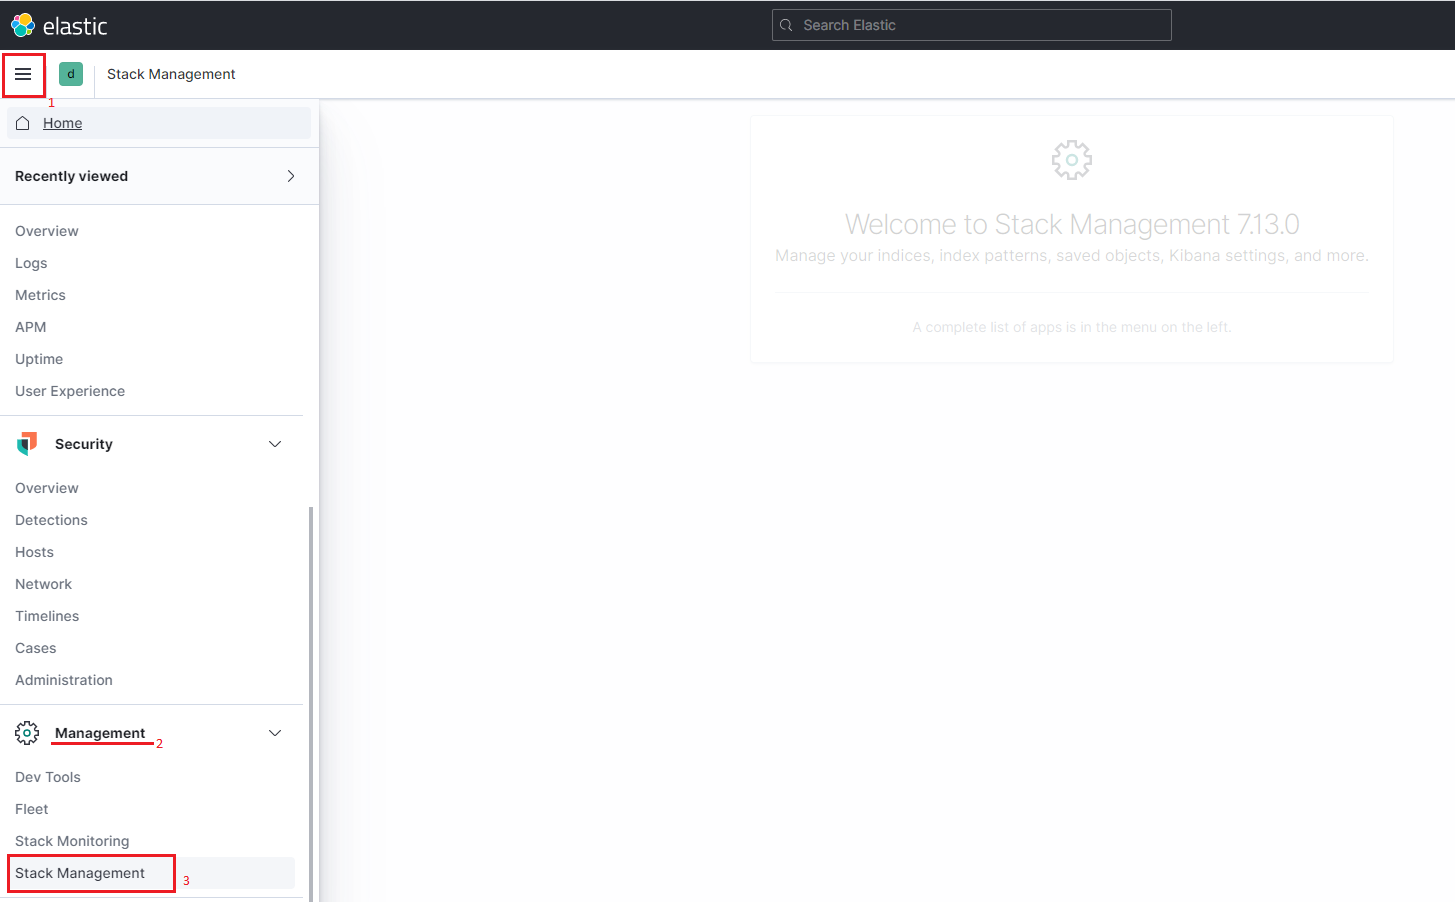
On the left sidebar menu look for Kibana → Saved Objects and click it.
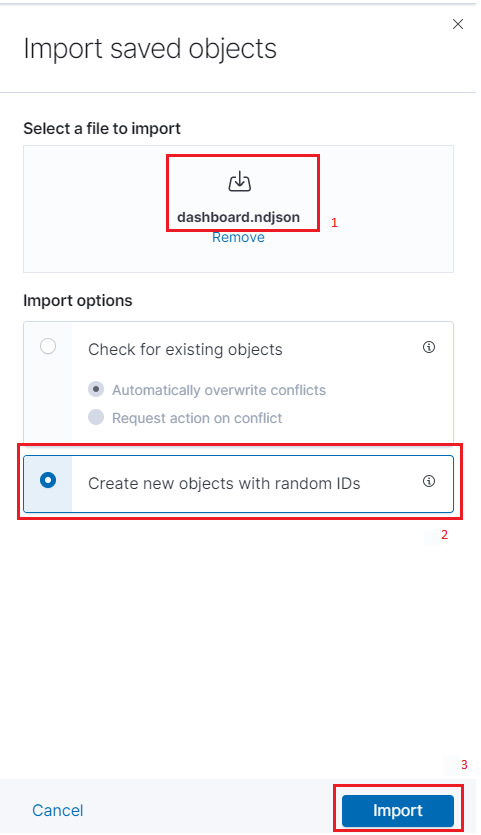
Click the Import button and a sidebar menu will appear. Complete the following steps:
Click the new import button inside the Select a file to import section
1and choose the dashboard.ndjson file (with the changes made in step 1) from your file system.Select the option Create new objects with random IDs
2.Finally, click the Import button
3at the bottom.
Now click the bars menu icon on the left of the navigation header
1and search for Analytics2→ Dashboard3and click it. You should now see a list with all imported dashboards (including this one). Just click on the name to see it working.
Once the dashboard is opened, for a best user experience we recommend clicking the option Full screen.
Dashboard
This section briefly describes how the dashboard is organized and works and some of the charts that it contains.
Filtering
The dashboard has some infocard controls, each one targeting a different type of filter.
Warning
When applying a filter, all charts will be automatically refreshed after applying the selected filter.

Datastores
You can select a Datastore from one of the lists. This will also enable the Path filter field showing only the paths available for the selected datastore.
Infotype
You can filter by any of the infotypes found in the data objects file (index) that the dashboard is pointing to.
Risk
A numerical slider with the minimum and maximum risk values is available. You can set the risk range that you want to filter.
Tip
Besides these filters, you can also click in the charts to apply filters that will be added at the top of the dashboard for visibility.
Charts
Summary
At the top of the dashboard there are some quick infocard chart metrics showing a summary status of the current data objects file(s) with or without filters.

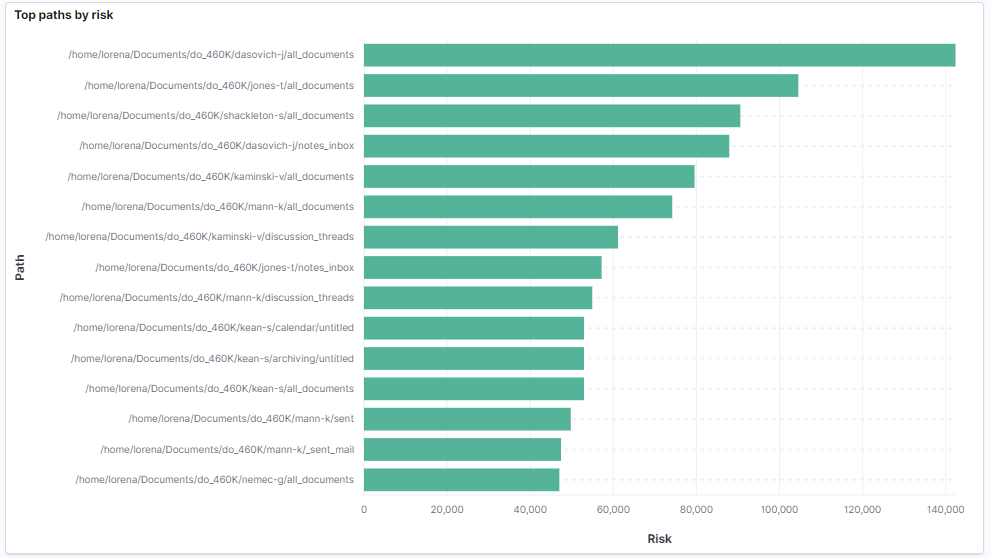
Top paths by risk
This chart aggregates the risk by path. It shows the top 15 paths with more risk in descending order.
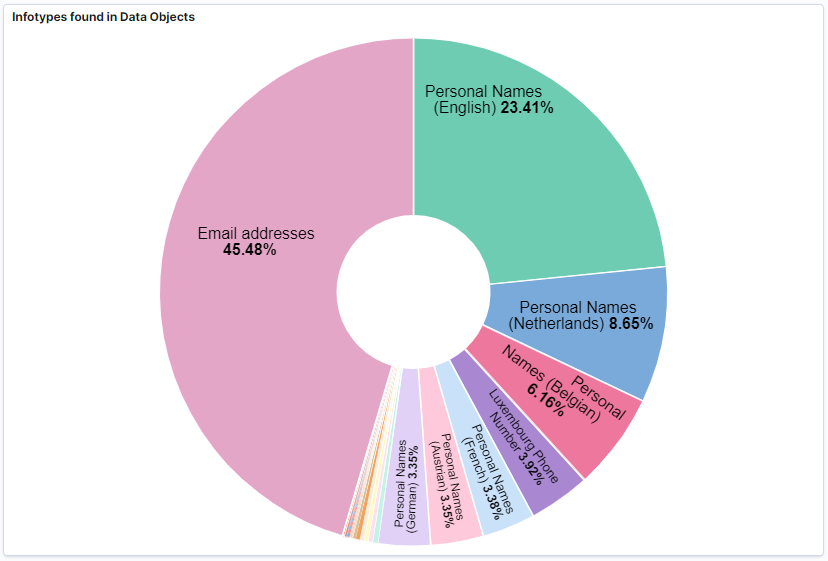
Infotypes found in Data Objects
This chart shows the infotypes found for each data objects. The percentage is relative to the total number of infotypes found. For instance, if Email Addresses were 25%, this would mean that from all the infotypes found this one is present 25% of the time.
Sensitive Data Objects
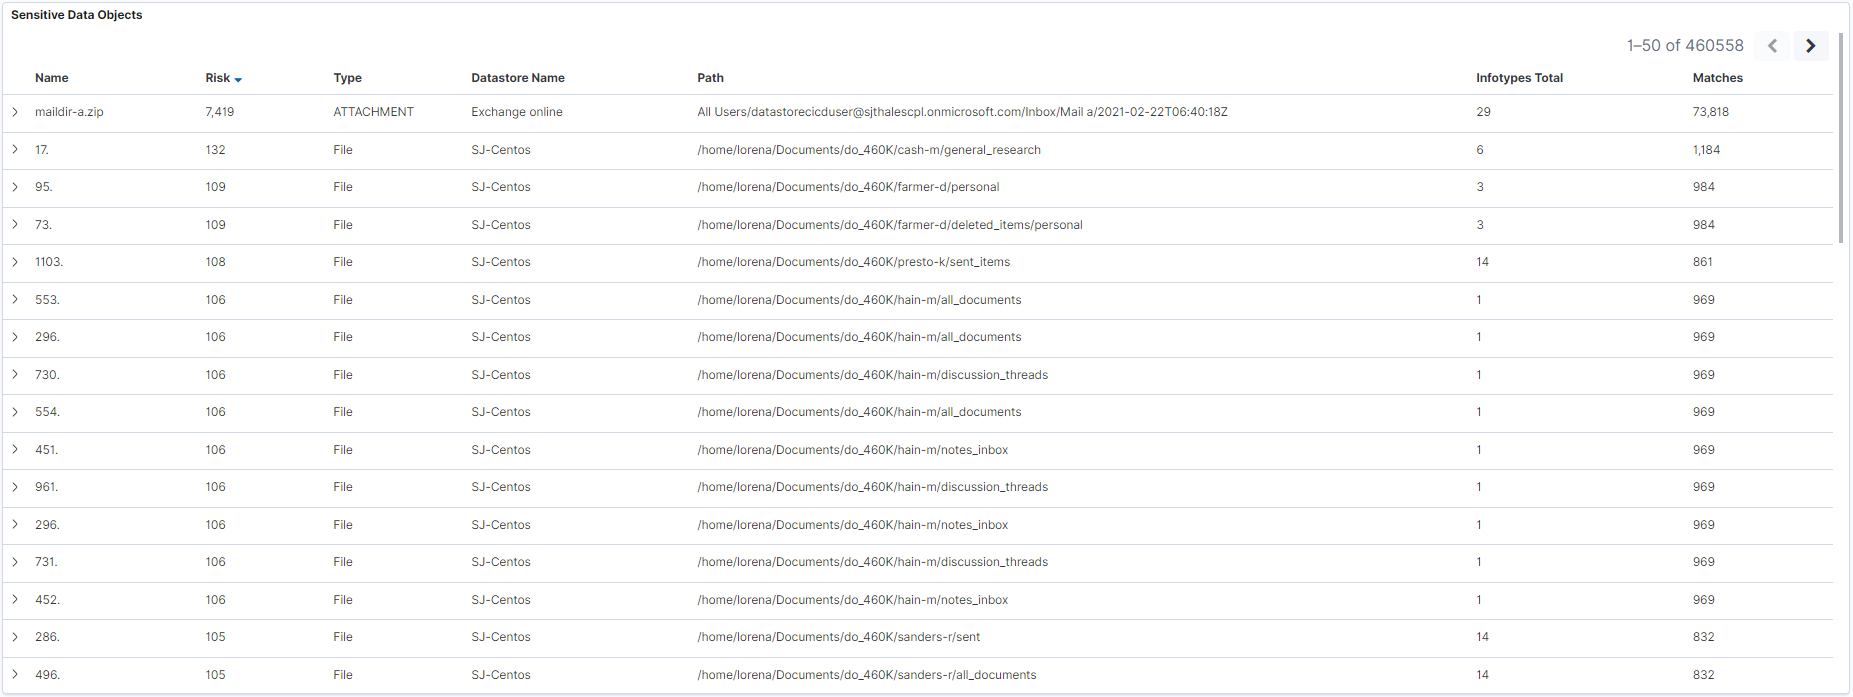
This table shows the most relevant information for each data object. The table works with all the data objects but pagination is limited to the first 500 top rows. By default, it is ordered by risk, in descending order but you can choose any column for ordering. Take into account that this table allows multi-sorting. These are the instructions for sorting:
single sorting: for ordering only by a new column, for example, Matches, first click sorting on the specific column (Matches), then click sorting for the column that was being sorted (Risk if it is the first time as it is the default one) to stop sorting by it. In the end, you should only see one sorting arrow in the new column (Matches) and none in the rest ones.
multi-sorting: you just need to click in the columns you want to sort in the order you want the sorting to be applied. For instance, if you click Infotypes Total then the table will be sorted first by Risk descending (the default one) and second by Infotypes Total ascending. You can apply as many sortings as you want just clicking the column. You can disable any of these sortings by clicking again the column you want to stop sorting until the sorting arrow is gone for that column.
Advanced options
This section describes some advanced use cases.
Managing spaces
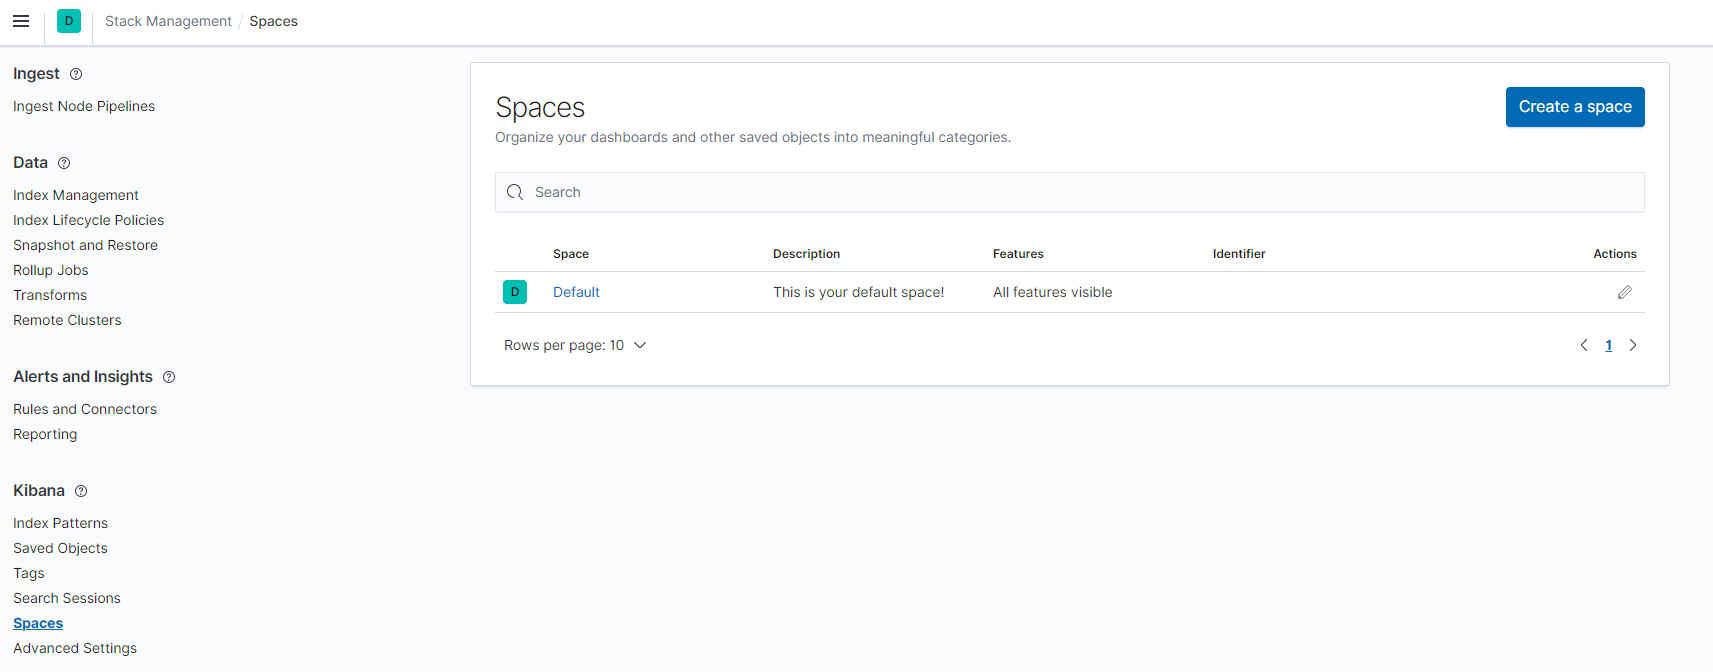
ELK allows you to create different spaces where you can organize everything related to features and visualization. By default ELK has one space already created that is called Default.
Warning
Data is shared across all the existing spaces. All Elasticsearch indexes will be accessible from any space.
In order to manage spaces for the first time you have two options:
Click the bars menu icon on the left of the navigation header and search for Management → Stack Management and click it. Now in the sidebar menu under the Kibana section click Spaces.
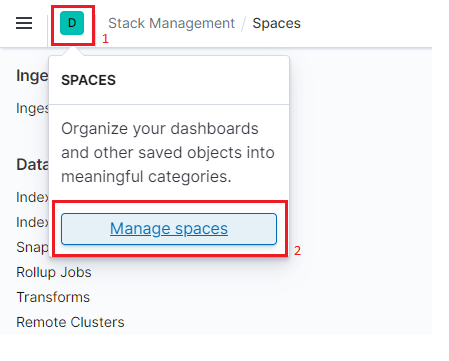
On the right of the bars menu icon of the navigation header there is a letter D (for "Default" space). If you click it
1, a little menu will appear so that you can now click the Manage spaces button2.
In either case you should end up in the spaces list page:
Creating a new space
Under the space list page you can now click the Create a space button to create a new space. You will be redirected to a new page with a form to be filled. Just fill the Name field with any name that you want, and click the Create space button at the bottom.
Switch between spaces
To switch between spaces you have now two options:
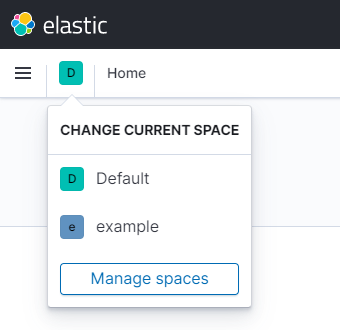
- On the right of the bars menu icon of the navigation header there is a letter. If you click it, a little menu will appear so that you can now switch between spaces.
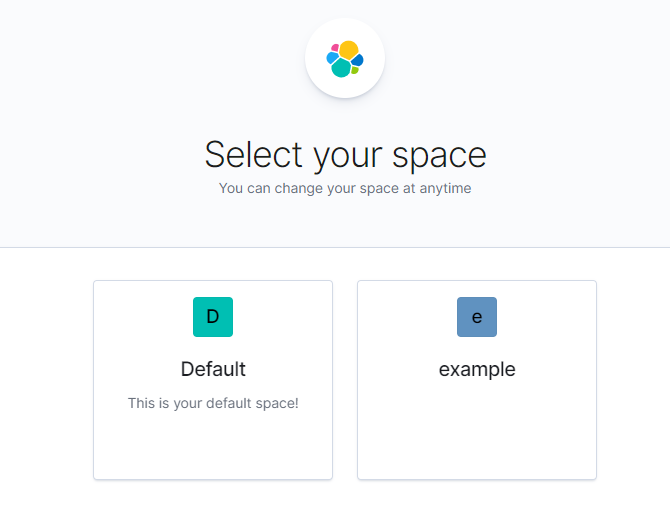
- If you navigate to the root of ELK in the URL (http://localhost:5601 by default) you should now see a menu like this letting you choose your space:
Multiple dashboards
Sometimes you may need to have more than one dashboard pointing to different Elasticsearch indexes (data object files). Depending on your needs or preferences, you can choose between importing additional dashboards in the same current space or in a different one.
Dashboards in the same space
It is possible to repeat the process of importing a dashboard (see How to import the ELK dashboard) several times in the same space but it requires some additional steps. When importing a dashboard, the name of the dashboard (and all its associated children) are maintained by default. This means that if you import the same dashboard more than once in the same space you will have two dashboards with the same name, even though they are targeting different indexes.
To avoid this problem we recommend that you modify the default name of the dashboard each time you perform an import. This can be easily done after importing the dashboard by following these steps:
Go to your list of dashboards (see list of dashboards).
Click the pencil icon of the dashboard that you want to change the title of. It will navigate to the dashboard, in edit mode.
At the top of the available options, click Save as.
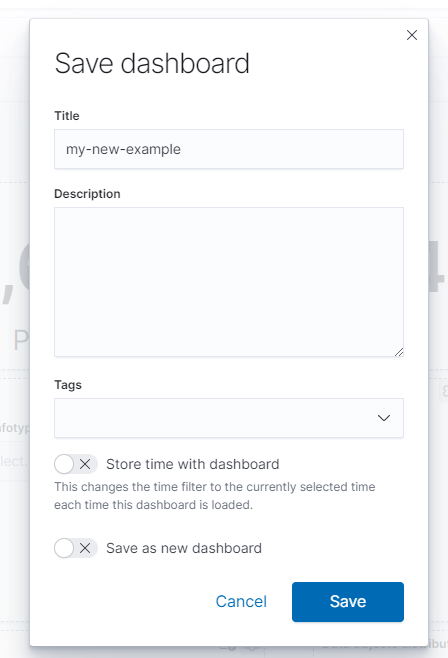
A popup menu appears. Change the Title field, deselect the Save as new dashboard option an click the Save button to finish.
Dashboards in different spaces
The easiest way and the recommended one for managing more than one dashboard is to import them in different spaces. The only thing that you need to do is:
Create a new space if you have not created it yet, and switch to it (see Managing spaces).
Import the dashboard again (see How to import the ELK dashboard).
Working with big data object files
By default ELK has a limitation of the file size to upload when ingesting - it is 100 MB per file. This limitation can be increased up to a maximum of 1 GB. To accomplish this:
In your ELK UI click the menu bar icon on the left of the navigation header and search for Management → Stack Management and then click it to navigate to the section.
On the left sidebar menu look for Kibana → Advanced Setting and click it.
Look for the option field called Maximum file upload size and change its value to 1GB. It should look like it is illustrated in the image below. Next, click the Save changes button.

Warning
This setting must be repeated for each space.
Tip
If you download a report file from DDC larger than your maximum file size, you can split it into multiple smaller files and follow the steps from Working with many data object files together to aggregate all the parts into a single dashboard
Working with many data object files together
Sometimes even the maximum file size available is not enough or you want to have many data object files (indexes) aggregated under the same dashboard. It can be achieved by following these steps:
Ingest all the data objects that you want following the steps from How to ingest data objects in ELK and up to the limit that you have configured (100MB by default, see Working with big data object files). There is only one thing different that you should be aware of - instead of giving a random name in step 4.2 you should now follow a pattern. For instance you could name your files to be ingested in the following manner:
report-1,report-2,report-3...Now, import a dashboard following the steps from How to import the ELK dashboard but when editing the dashboard.ndjson file you should now use your pattern in the title. For instance, if you have followed the example above you should name it:
report-*This way all indexes that follow that pattern will be aggregated under this dashboard.


