Front-panel LCD Display
The LCD on front panel of the SafeNet Luna Network HSM provides basic configuration and status information for the appliance. The LCD is split horizontally into three individual sections as follows:
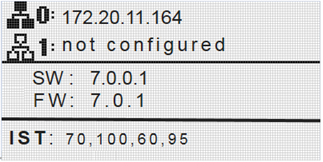
Figure 1: The LCD display
| Top |
Displays the current IP address configuration of the Ethernet ports on the appliance. If a port is configured, its IP address is displayed. If the port is not configured, the string "not configured" is displayed. This section automatically cycles between ports eth0 and eth1, and ports eth2 and eth3. The icons indicate the connection status of the port, as follows:
|
| Middle |
Automatically cycles between displaying the following information: >Software (SW) and firmware (FW) versions currently installed on the appliance >Appliance host name >HSM label and HSM serial number |
| Bottom |
Displays the current appliance state and status codes, as detailed in Appliance State and Status Codes. The icon shading indicates the appliance state, as follows:
|
Appliance State and Status Codes
The bottom section of the LCD displays the current appliance state and related status codes. The state can be one of the following.
| ISO |
In Service Operational. The appliance is operating normally. All services are running and the appliance is providing encryption/signing services as expected. |
| IST |
In Service Trouble. The appliance is operational, but is experiencing a fault condition. The required services are operational and the appliance is able to provide encryption/signing services, but some services, such as SSH, are not running. |
| OOS |
Out of Service. The appliance is not operational. The appliance is online but one or more required services are not operational. The appliance is not providing service. |
| OFL |
Offline. There is no network connectivity to the appliance. In this service state the appliance is not currently connected to the network and cannot provide service. |
Status Codes
Each state is associated with one or more status codes, which provide additional information about the status of the appliance. For example, if there are no faults detected, the display indicates that the appliance is in service (ISO), with status code 0, so the display reads "ISO 0."
The codes are listed in the following table. You can also use the LunaSH status sysstat code all command to display a list of the possible status codes.
If one or more faults have been detected, the display shows the most severe status code until that fault has been corrected, then it displays the next most severe status code, until all errors have been corrected.
NOTE Not all faults are serious. Some might merely indicate that an available service is not running because you chose not to run it.
The displayed messages update following a scan of selected system conditions, approximately every 15 seconds. If you have fixed a fault that caused an error, the display should clear the error indication at the next update. If the display continues to show the error message, then the fault may have re-occurred and you should investigate.
|
State |
Status |
Description |
|---|---|---|
|
ISO |
0 |
In Service Operational. No trouble. |
|
60 |
In Service Operational. The eth0 interface is offline. Use the LunaSH network show and service status network commands to display more information about the status of the network interfaces. |
|
|
61 |
In Service Operational. The eth1 interface is offline. Use the LunaSH network show and service status network commands to display more information about the status of the network interfaces. |
|
| 62 |
In Service Operational. The eth2 interface is offline. Use the LunaSH network show and service status network commands to display more information about the status of the network interfaces. |
|
| 63 |
In Service Operational. The eth3 interface is offline. Use the LunaSH network show and service status network commands to display more information about the status of the network interfaces. |
|
|
|
In Service Operational. The STC service is not running. Use the LunaSH service status stc command to display more information about the status of the STC service. |
|
| 95 |
In Service Operational. The webserver service is not running. The REST API is not available. Use the LunaSH service status webserver command to display more information about the status of the webserver service. |
|
|
100 |
In Service Operational. The SNMP service is not running. Use the LunaSH service status snmp command to display more information about the status of the SNMP subsystem. |
|
| OOS |
20 |
Out of Service. The NTLS service is not running. Use the LunaSH service status ntls command to display more information about the status of the NTLS service. |
|
25 |
Out of Service. The NTLS service is not bound to an Ethernet device. Use the LunaSH service status ntls command to display more information about the status of the NTLS service, and the syslog tail command to view the system logs to help troubleshoot the issue. |
|
|
30 |
Out of Service. The HSM service has experienced one or more errors or critical events. Use the LunaSH hsm information show and syslog tail commands help troubleshoot the issue. |
|
|
OFL |
50 |
Off Line. None of the Ethernet interfaces are connected to the network. Use the LunaSH network show command to display more information about the status of the network, and the syslog tail command to view the system logs to help troubleshoot the issue. |
|
IST |
70 |
In Service Trouble. The syslog service is not running. Use the LunaSH service status syslog command to display more information about the status of the syslog service, and the syslog tail command to view the system logs to help troubleshoot the issue. |
|
90 |
In Service Trouble. The SSH service is not running. Use the LunaSH service status ssh command to display more information about the status of the syslog service, and the syslog tail command to view the system logs to help troubleshoot the issue. |
|
|
110 |
In Service Trouble. Hard disk utilization is too high. Use the LunaSH syslog tarlogs command to create a tar archive of the logs and then use scp to transfer the log archive from the appliance to a remote computer for archiving. |